Demonstration · Illustrative data · BI Consulting Services
Superior Group of Companies × BI Consulting Services

People Analytics Board · fed from ADP

Seven HR dashboards, one refresh. ADP Workforce Now payroll, time and recruiting extracts landed nightly, modelled once, and served across every segment in Power BI.
Prepared for Tara September 2026
7 DASHBOARDS · 1 MODEL

One people model across three public segments — and Corporate

Superior Group of Companies (NASDAQ: SGC) reports three operating segments. The board below uses those segments plus a Corporate slice as its organising spine, so every dashboard answers the same question at the same grain: segment × region × month.

Branded Products · BAMKO Healthcare Apparel · Fashion Seal Healthcare Contact Centers · The Office Gurus Corporate
How the data gets here
  1. ADPWorkforce Now · payroll, time & attendance, recruiting
  2. Nightly extractAPI / scheduled export into a lakehouse
  3. One semantic modelWorker, position, pay period, requisition
  4. 7 dashboardsPower BI · row-level security by segment
Segment
Region
Period
The 7 dashboards Tara identified01–04 rendered in full · 05–07 previewed
01

Headcount & org

ADP source: Worker · Position · Location

The org fabric — headcount woven by segment and region

FIG 1.1Warp = segment (column width ∝ active headcount), weft = region (row height ∝ share). Dashed copper selvedge marks a cell with annualised voluntary turnover above 30%. Hover any cell.

What this board answers

LIVE

Active headcount by month

FIG 1.2Month-end active workers in scope; the band shows the prior equal-length window for comparison.

Span of control & org shape

FIG 1.3Workers per people-manager, by segment. Target band 6–12.
02

Turnover & retention

ADP source: Worker status history · Termination reason

Exits by month — voluntary vs involuntary

FIG 2.1Stacked monthly exits in scope with the annualised voluntary turnover rate as a line (right label).
VoluntaryInvoluntaryAnnualised voluntary rate

Annualised voluntary turnover by cell

FIG 2.2Segment × region, ranked. Rule at 30%.

First-year retention

FIG 2.3Share of hires still active at 90 days and 365 days, by segment.

Exit reasons — voluntary only

FIG 2.4From ADP termination reason codes, mapped to five families.
03

Hiring funnel & time-to-fill

ADP source: Recruiting · Requisition · Applicant

Requisition funnel

FIG 3.1Applicants → screened → interviewed → offers → hires, for the selected period. Stage conversion shown between bars.

Median time-to-fill by segment

FIG 3.2Days from requisition open to accepted offer. Rule at the 30-day target.
04

Overtime & labour cost

ADP source: Time & attendance · Payroll register

Overtime hours as a share of paid hours

FIG 4.1Monthly overtime %, with the 5% policy ceiling. Bars = overtime hours.

Overtime premium by segment

FIG 4.2Illustrative overtime premium cost (the 0.5× uplift) for the period.
05 – 07

Previews — the remaining three dashboards

Same model, same filters · built out in the engagement
AI

Ask the data

Natural-language layer over the same semantic model · runs on your own server
Also from BI Consulting Services

Private AI on your own server

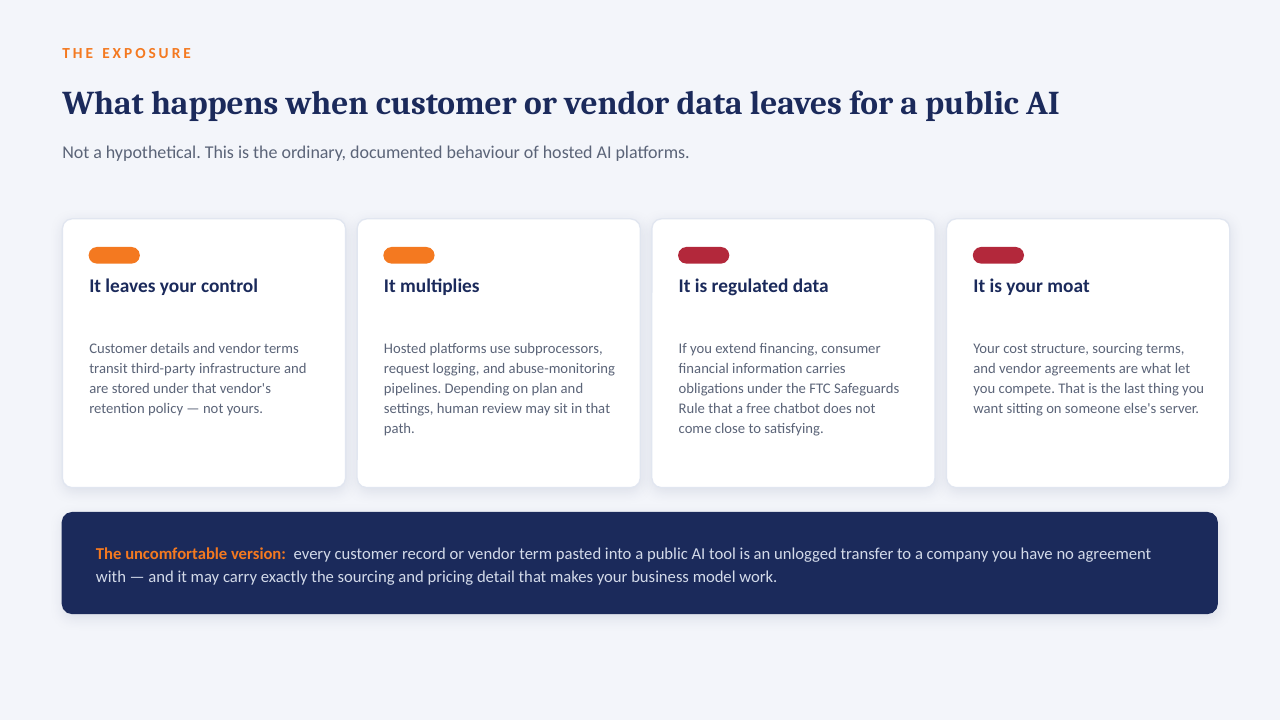
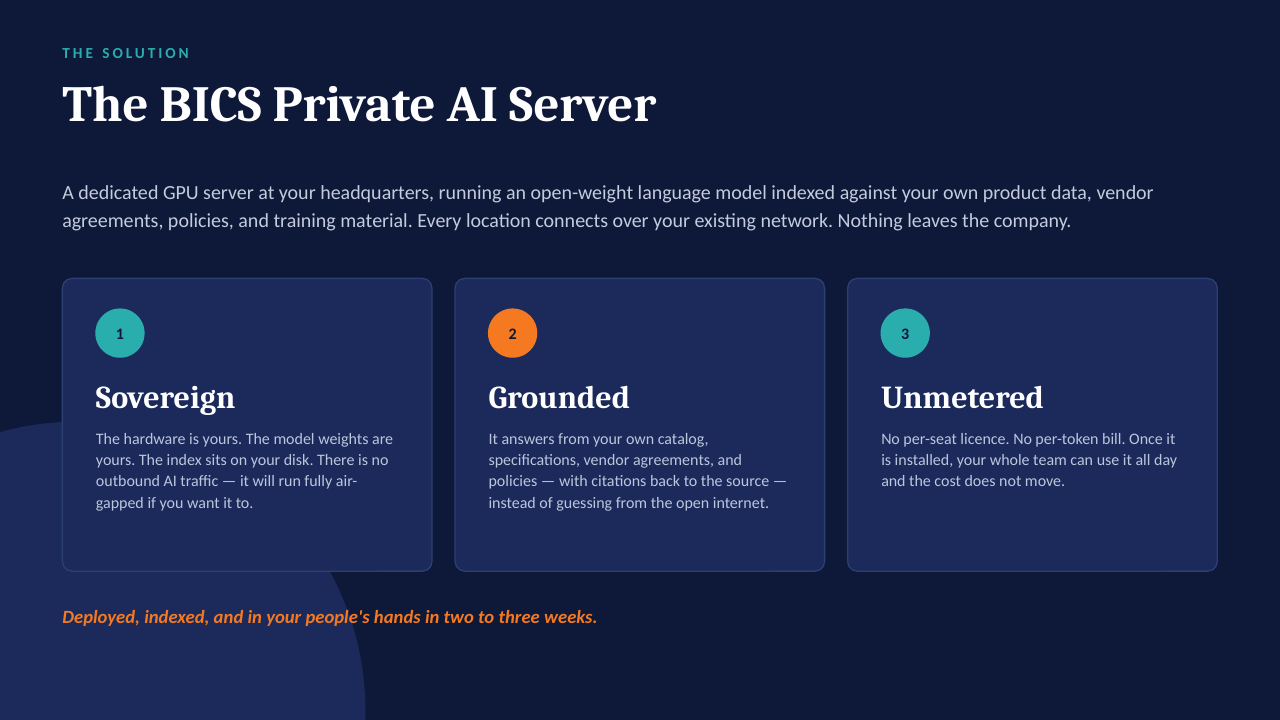
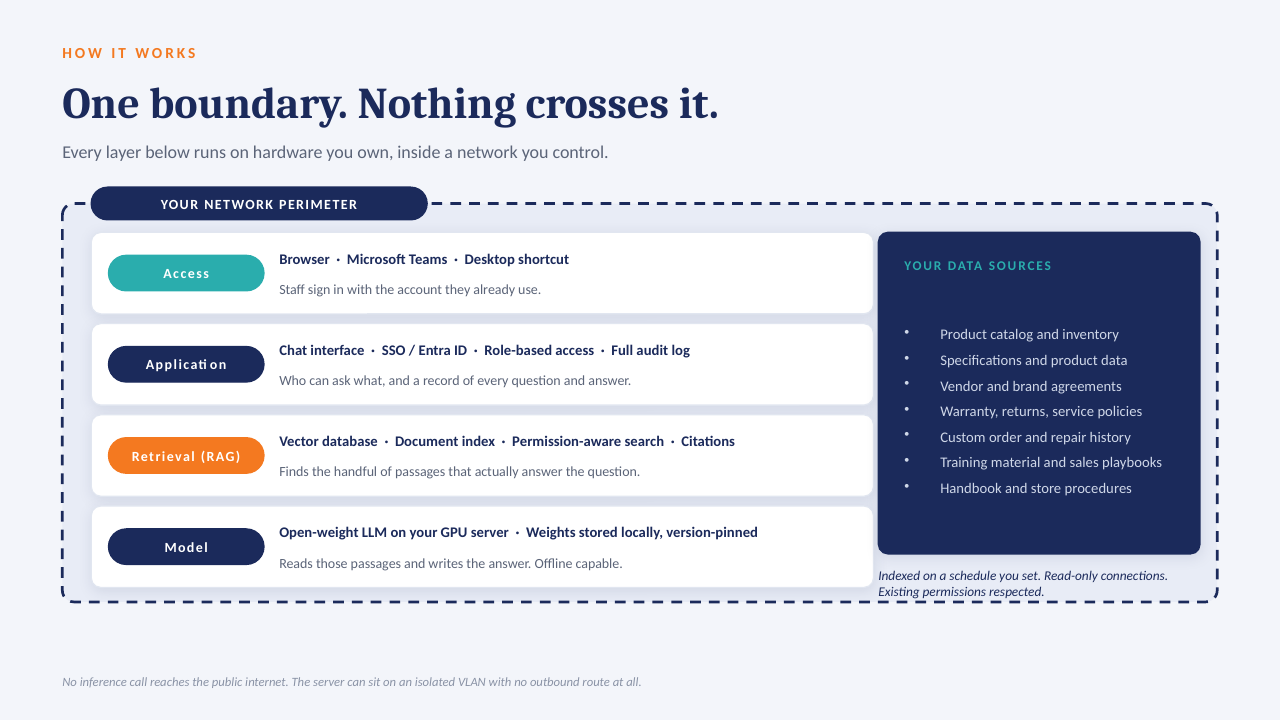
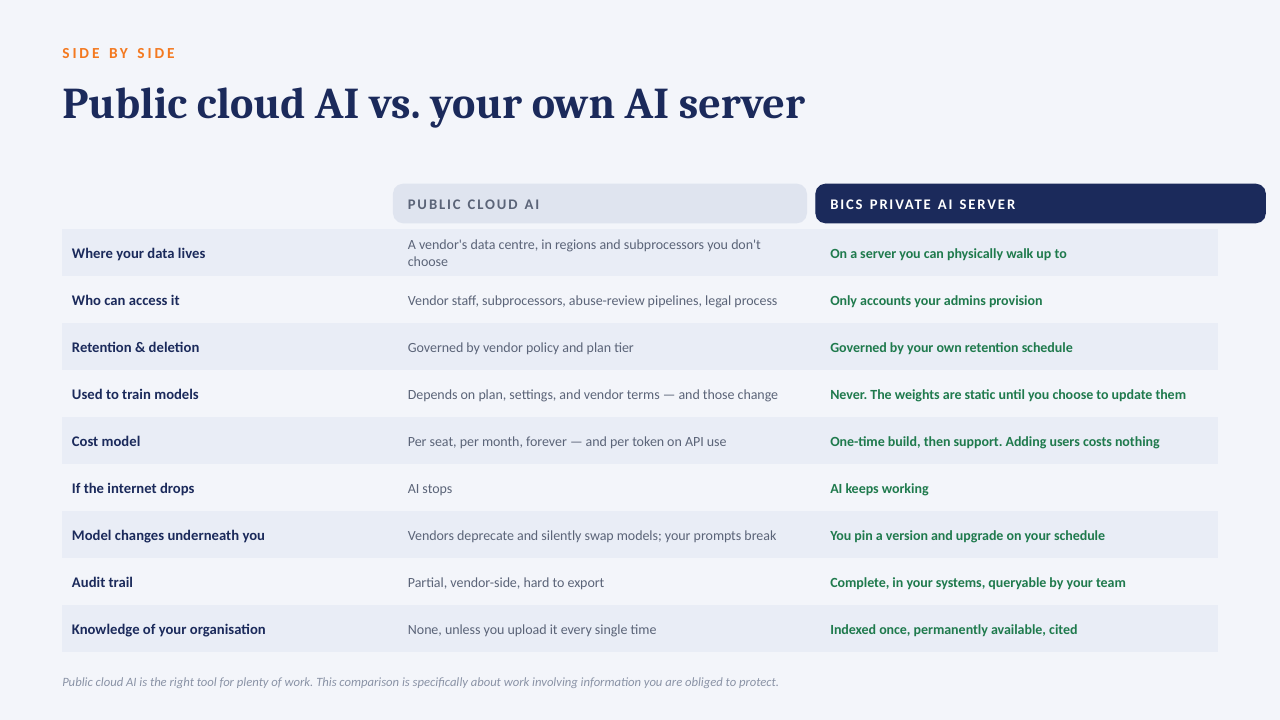
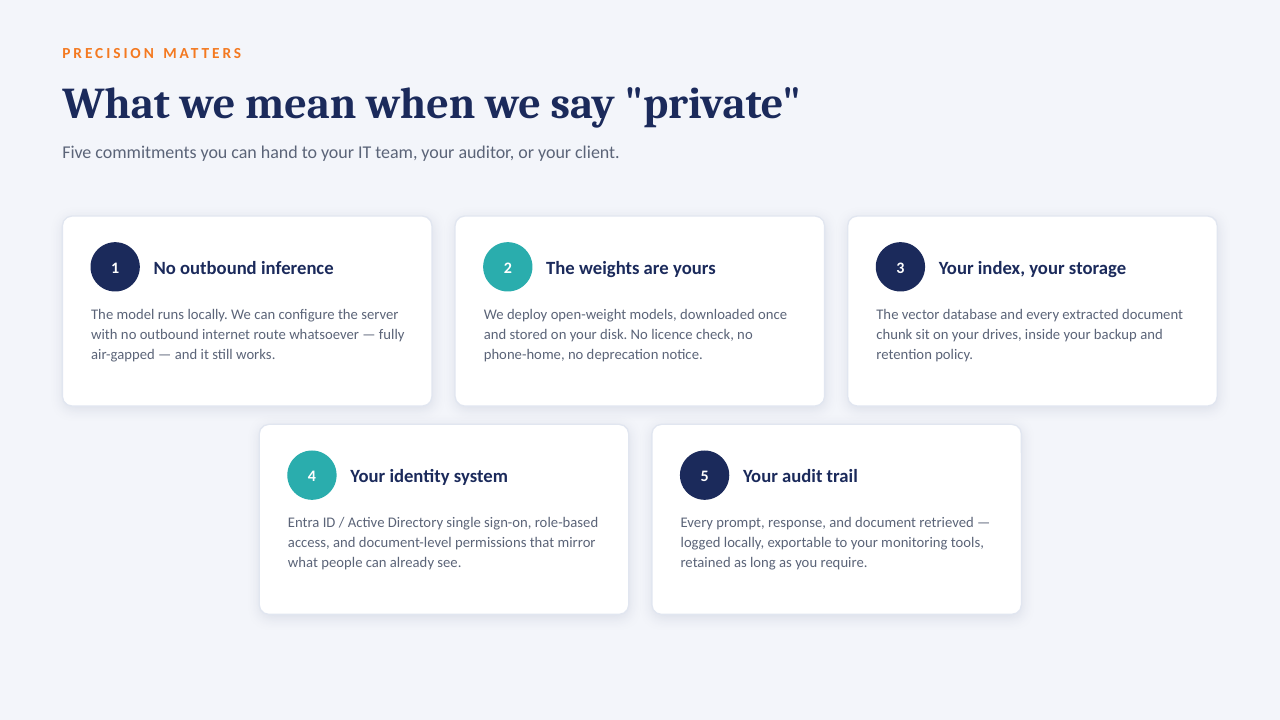
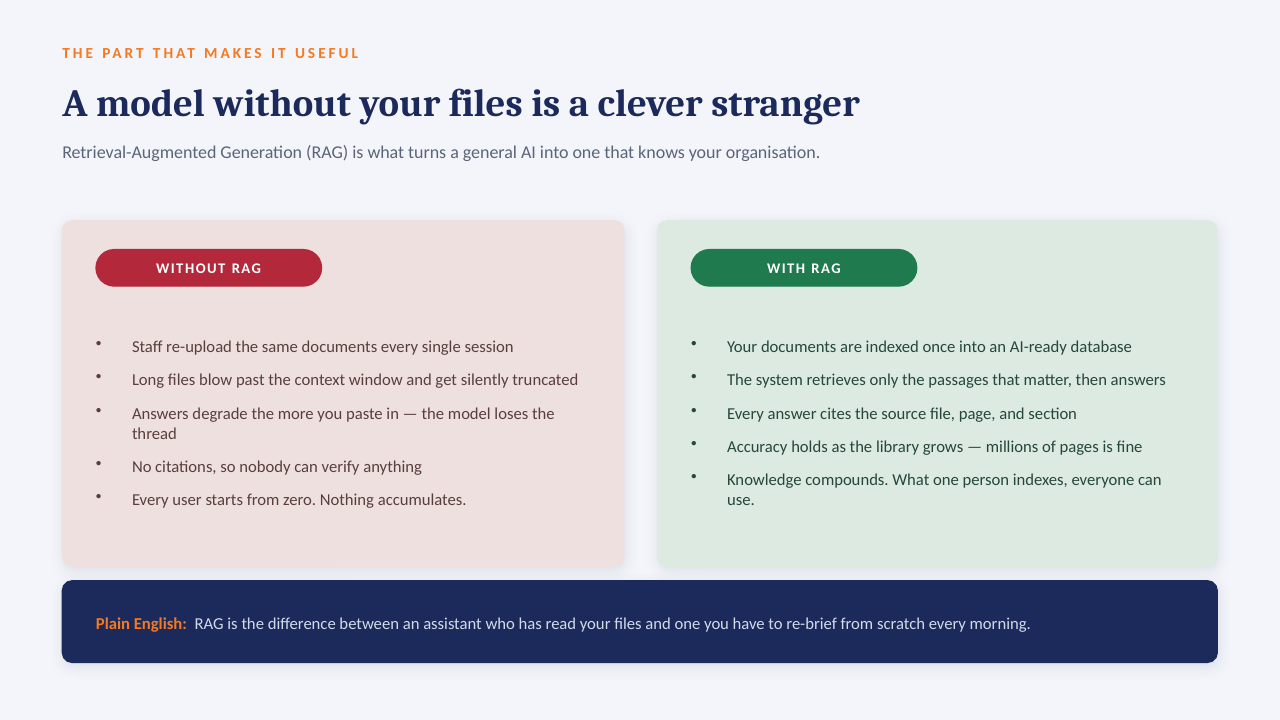
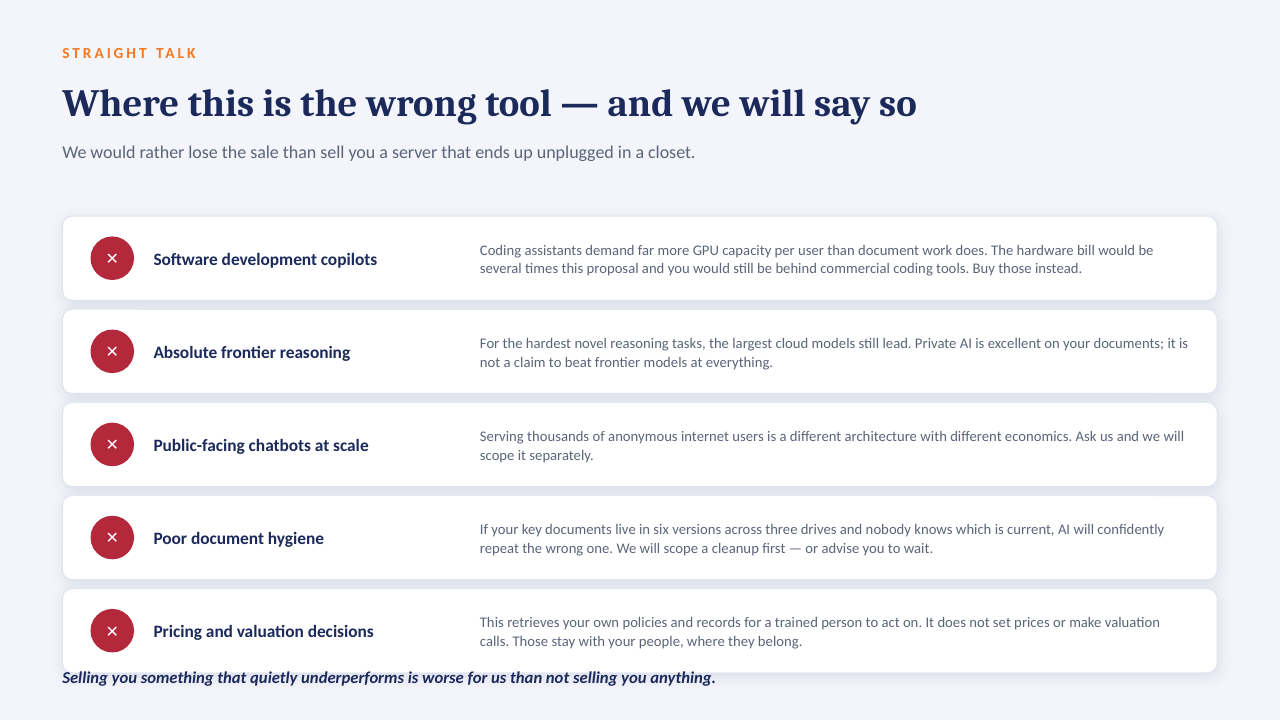
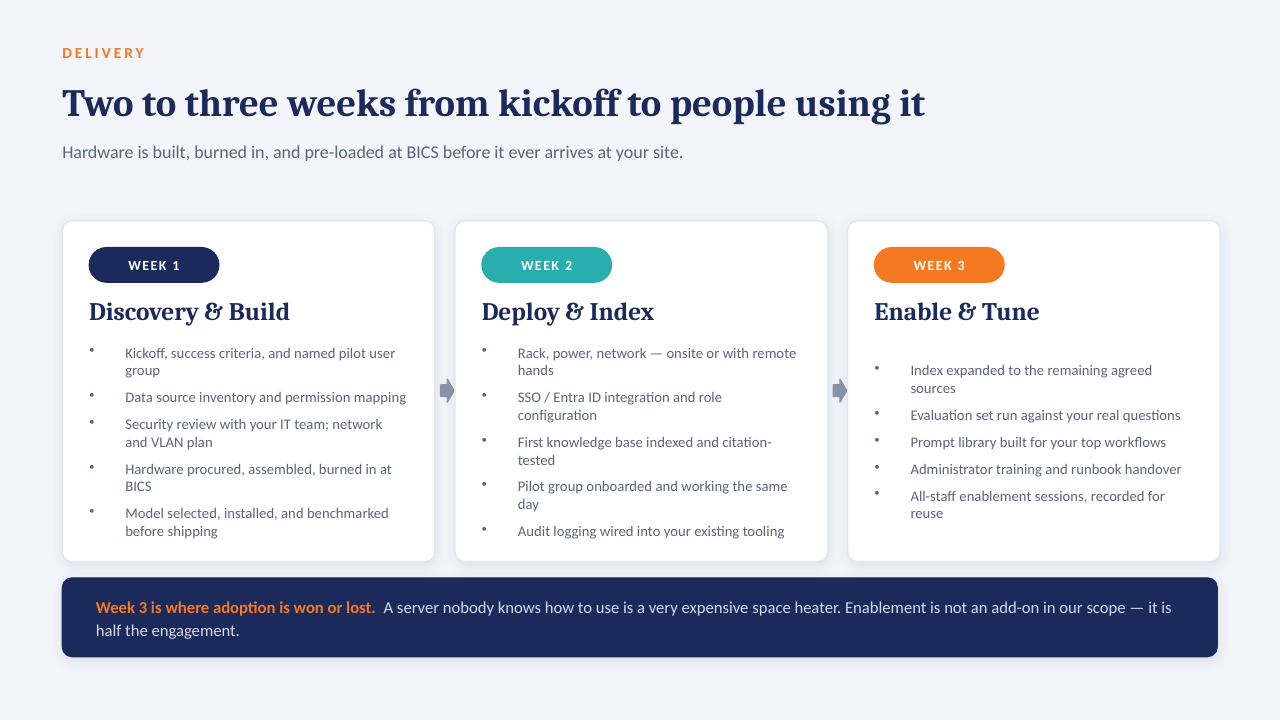
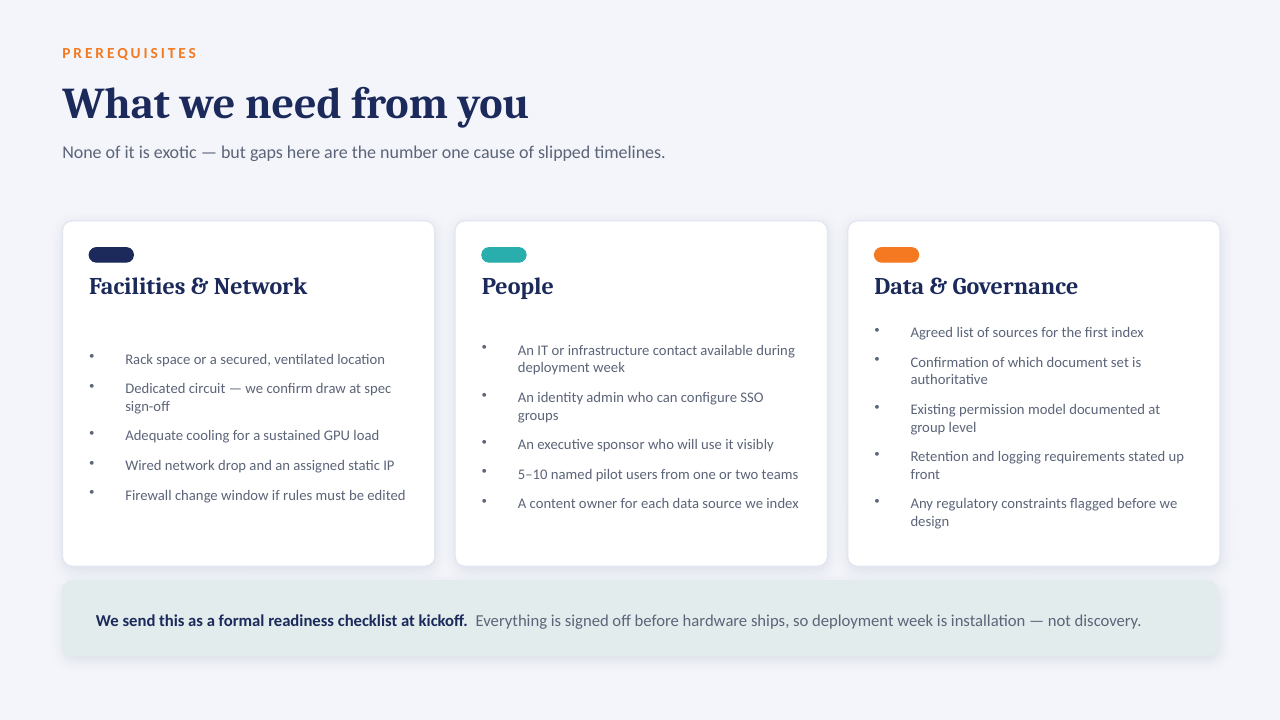
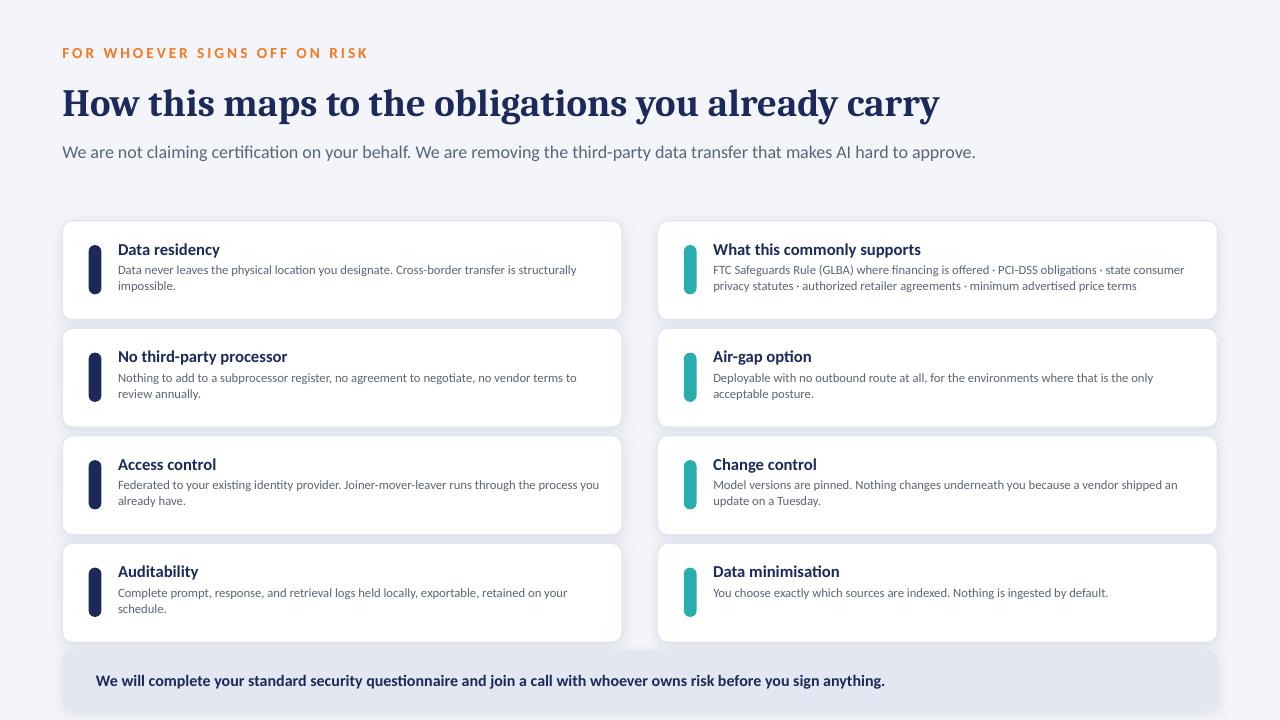
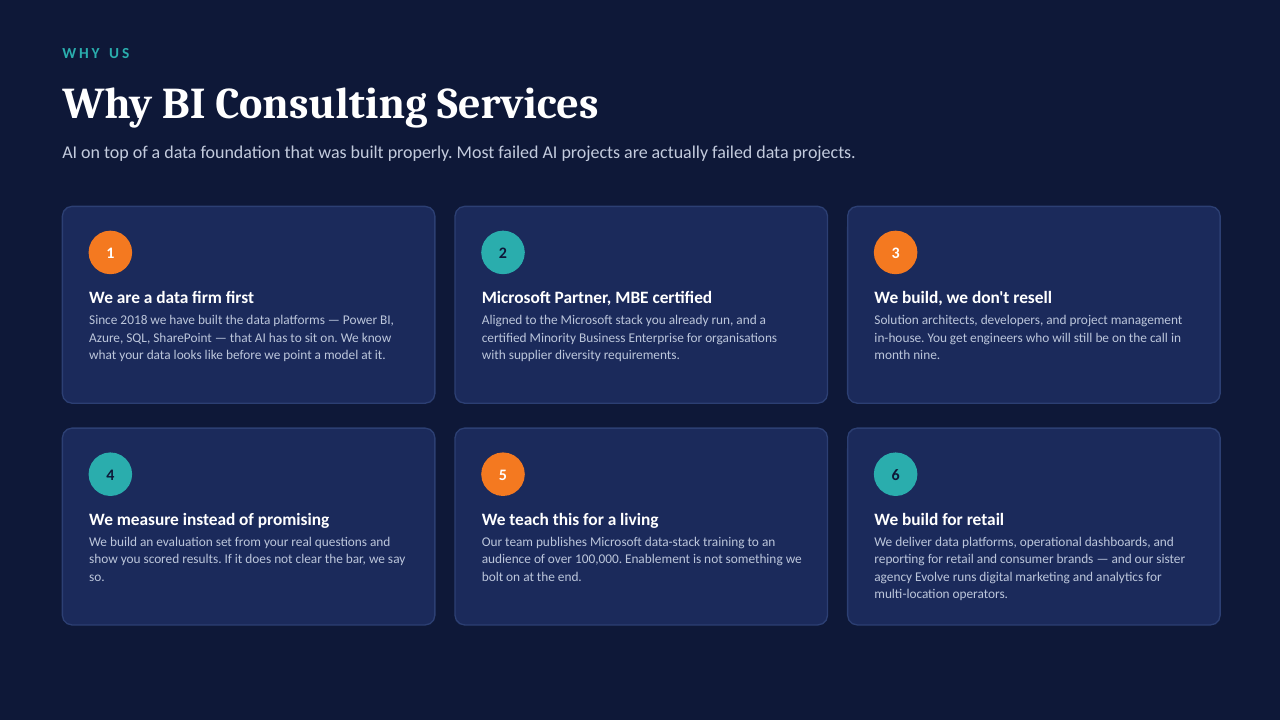
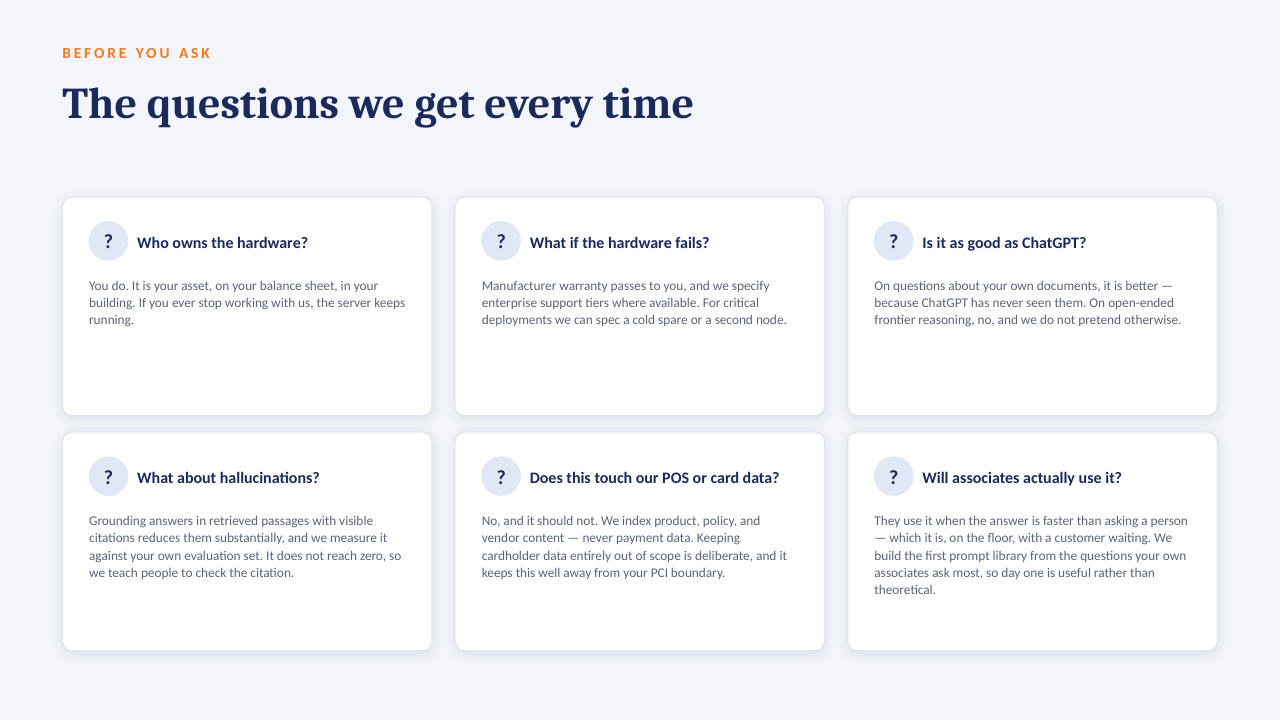
The "ask the data" ideas on this board are designed to run on a GPU server inside your own network — an open-weight model over your own documents, cited answers, no per-seat licence, nothing leaving the building. The short deck below explains how it works. Scroll through, or download it as a PDF.

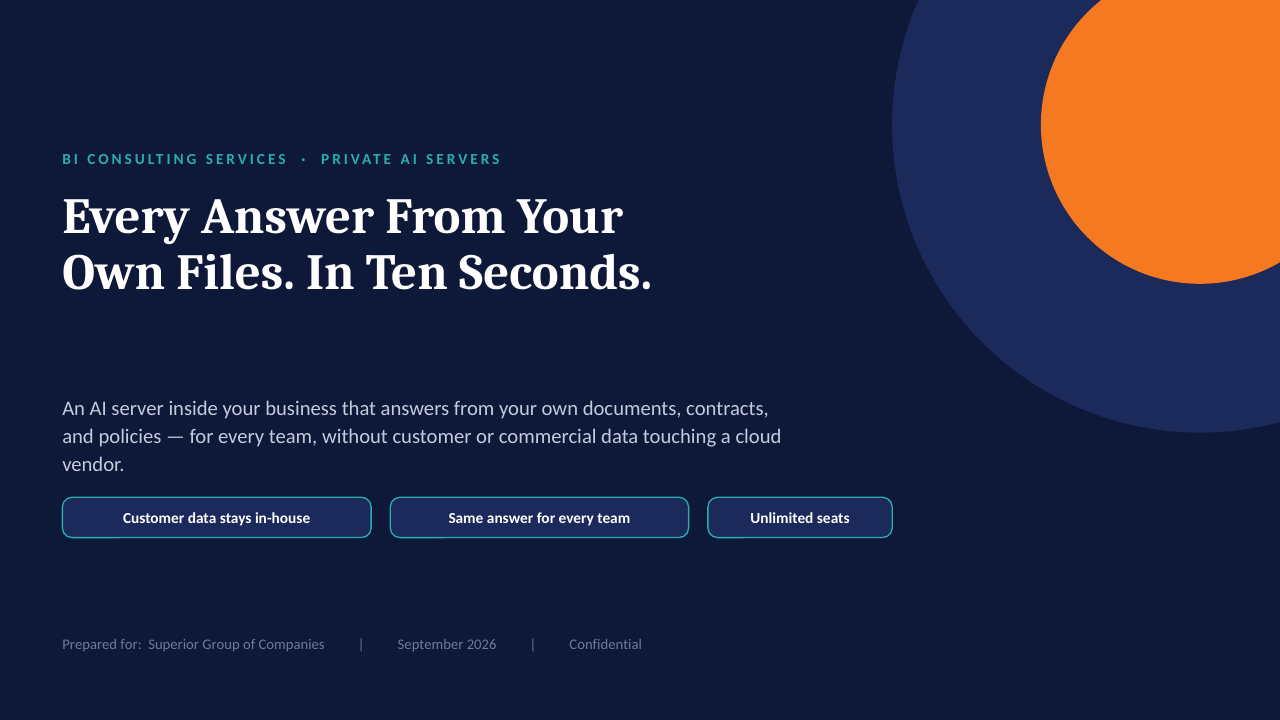
Private AI Servers — slide 1 of 14
Private AI Servers — slide 2 of 14
Private AI Servers — slide 3 of 14
Private AI Servers — slide 4 of 14
Private AI Servers — slide 5 of 14
Private AI Servers — slide 6 of 14
Private AI Servers — slide 7 of 14
Private AI Servers — slide 8 of 14
Private AI Servers — slide 9 of 14
Private AI Servers — slide 10 of 14
Private AI Servers — slide 11 of 14
Private AI Servers — slide 12 of 14
Private AI Servers — slide 13 of 14
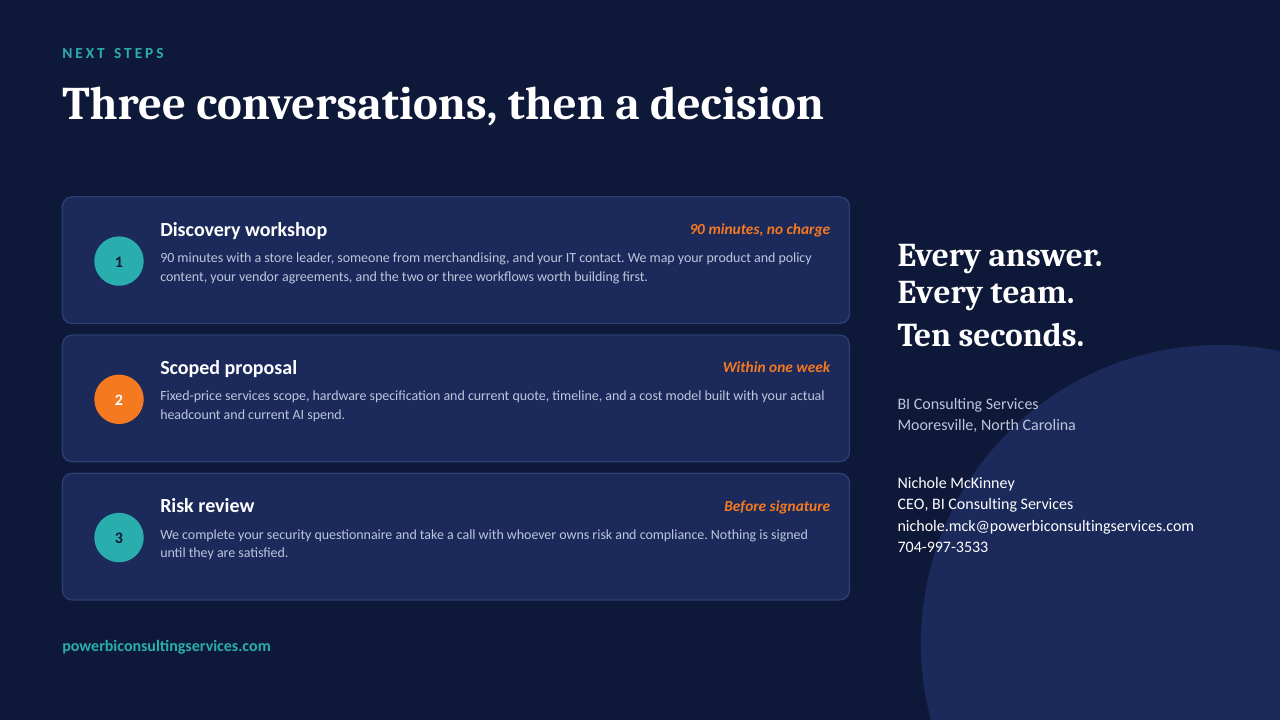
Private AI Servers — slide 14 of 14

Questions? Book 30 minutes: calendly.com/powerbiconsultingservices/30min